Self Hosted Server Monitoring and Observability
Prometheus is a widely used metric monitoring tool, especially in the world of Kubernetes and large-scale deployments. However, you don’t need a big, complicated setup like that to make use of it! In this tutorial, I will walk you through setting up three critical components to start monitoring your servers:
- Prometheus Server: Installed as a SystemD Service
- Node Exporter: Installed as a SystemD service
- Perses Dashboards: Installed via Docker
Typically, Prometheus pairs nicely with Grafana dashboards, and most articles cover this deployment route. However, to mix it up a little, I’ve chosen to go with another up-and-coming Cloud Native Foundation project, which I think is definitely worth your attention: Perses. We will install it using Docker, and get you up and running with a working dashboard to look at Linux machine metrics. Hopefully, by the end of this article, you will have a good starting point to grow and refine your monitoring processes.
Creating a User and Group to run our Services
sudo groupadd -f prometheus
sudo useradd -g prometheus --no-create-home --shell /bin/false prometheus
sudo mkdir /opt/prometheus
sudo mkdir /opt/node_exporter
sudo chown -R prometheus:prometheus /opt/prometheus
sudo chown -R prometheus:prometheus /opt/node_exporter
Download and Install Prometheus
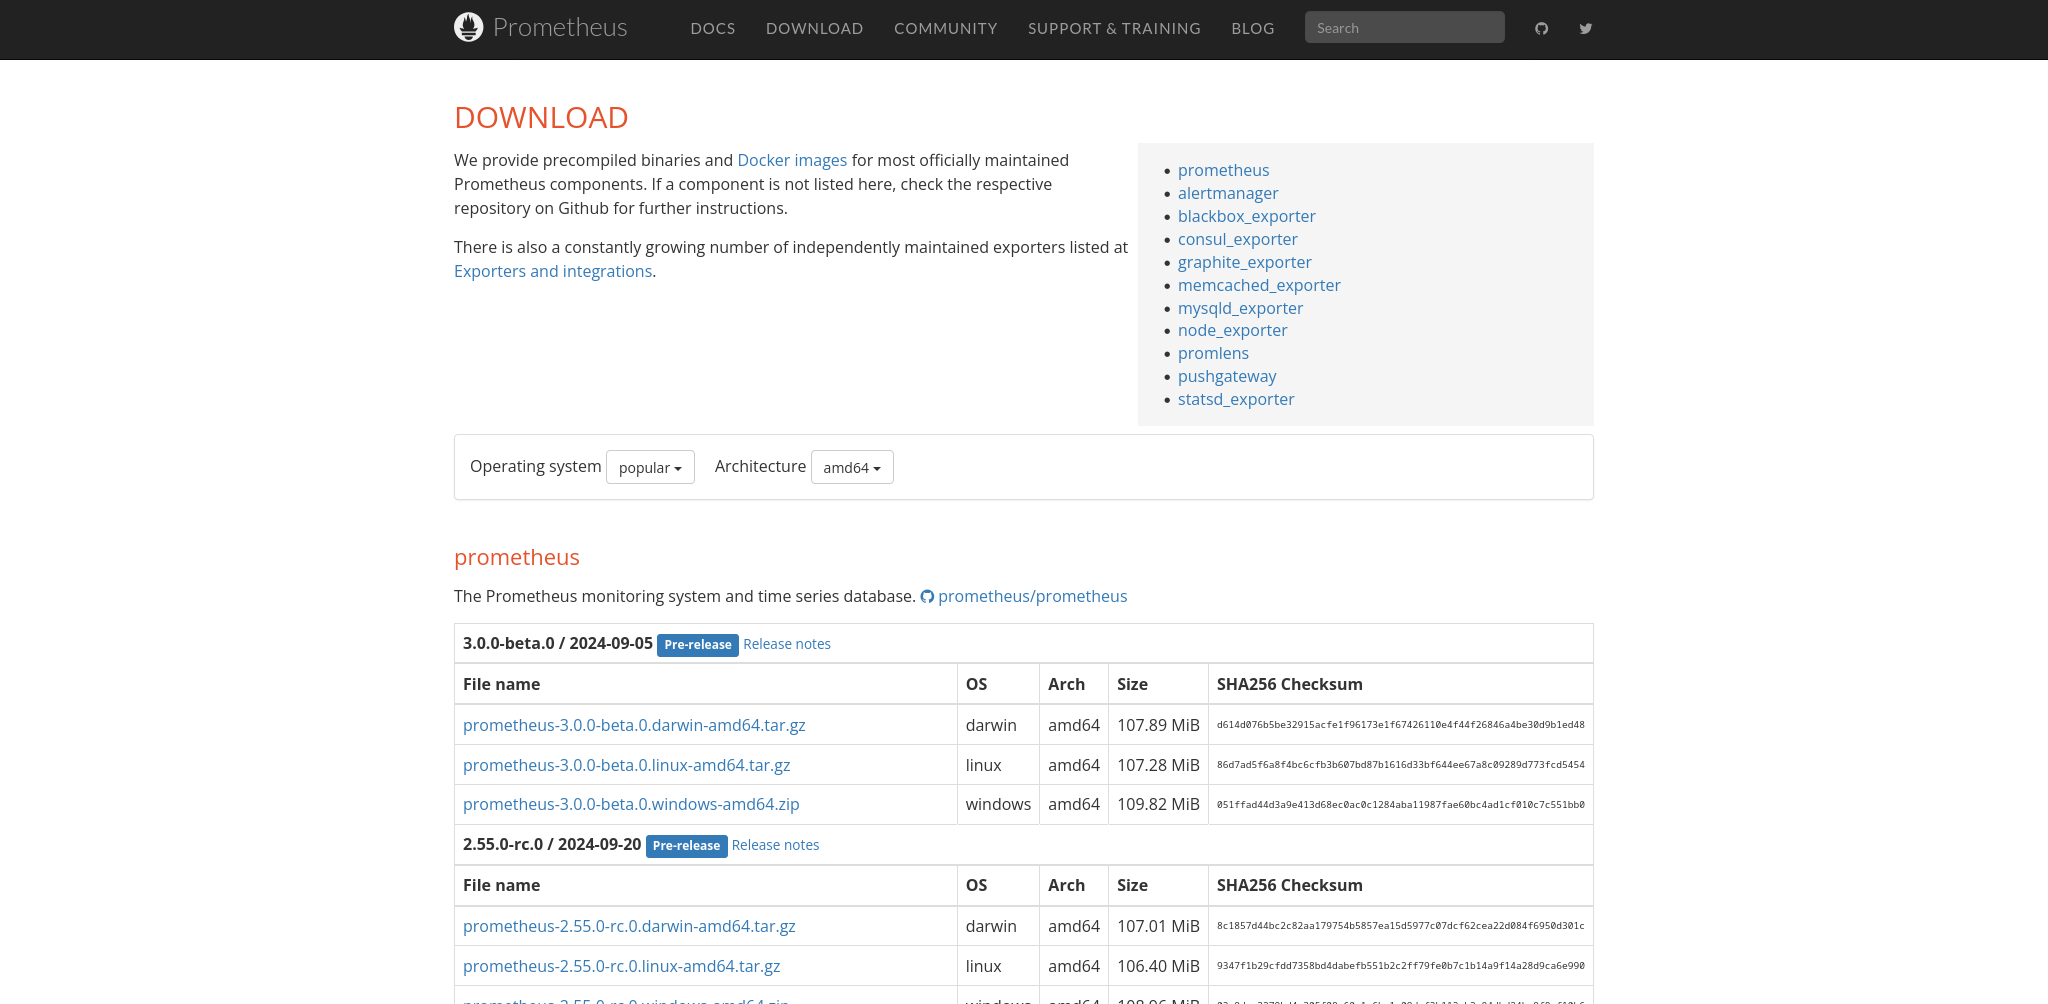
You can download the Prometheus binary here.
I recommend you SSH into your server and download the binary for your platform using the wget utility. In my case, I will be using the latest stable release (2.54.1 as of this article). In order to download the tar for my platform, I will use the following command:
wget https://github.com/prometheus/prometheus/releases/download/v2.54.1/prometheus-2.54.1.linux-amd64.tar.gz
Once you download the tar file, you can extract it using the following command:
tar xvzf prometheus-2.54.1.linux-amd64.tar.gz
Once you have extracted the files, move all files and folders located in your extracted directory to the /opt/prometheus directory using the following commands:
cd prometheus-2.54.1.linux-amd64
mv ./* /opt/prometheus
cd ../
# Clean up empty directory
rm -rf prometheus-2.54.1.linux-amd64
Running the ls command on the /opt/prometheus directory should return the following:
ls /opt/prometheus
> console_libraries  consoles  LICENSE  NOTICE  prometheus  prometheus.yml  promtool
The prometheus binary is all we need to run the server. However, before we set it up, we need to download the Node Exporter collector to get access to all host-specific machine metrics, such as CPU and memory utilization, network IO, and more. Let’s download it before we continue setting up Prometheus.
Download and Install Node Exporter
Node Exporter is a Prometheus-integrated exporter for collecting machine metrics. You can download it from the same site we just grabbed Prometheus from.
Again, SSH into your server and download the binary for your platform using the wget utility. In this tutorial, we’re installing it on the same machine as our Prometheus server, so we can run the following:
cd /opt/node_exporter
# Download the node exporter tar file and extract it
wget https://github.com/prometheus/node_exporter/releases/download/v1.8.2/node_exporter-1.8.2.linux-amd64.tar.gz
tar xvzf node_exporter-1.8.2.linux-amd64.tar.gz
# CD into the extracted folder and move the contents up a directory
cd node_exporter-1.8.2.linux-amd64
mv ./* ../
# Clean up empty directory
rm -rf node_exporter-1.8.2.linux-amd64
Set up the SystemD Service Files
Since we want Prometheus and Node Exporter to always be running and collecting metrics, the easiest way to accomplish this is to create SystemD service files for each of the binaries that we downloaded. If you are not using the prometheus user we set up above, then substitute the User=prometheus and Group=prometheus with your own user info. Use your favorite text editor to start stubbing out the service file. In this example, I am using nano:
sudo nano /usr/lib/systemd/system/node_exporter.service
Copy and paste the following:
[Unit]
Description=Node Exporter
Documentation=https://prometheus.io/docs/guides/node-exporter/
Wants=network-online.target
After=network-online.target

[Service]
User=prometheus
Group=prometheus
Type=simple
Restart=on-failure
ExecStart=/opt/node_exporter/node_exporter --web.listen-address=:9100

[Install]
WantedBy=multi-user.target
The important part to take note of is the ExecStart directive. We are calling the node_exporter binary and passing the argument for it to listen on port 9100. This is the default port Node Exporter listens on, so you can safely remove this option if you want. Let’s move on to the Prometheus server service file:
nano /usr/lib/systemd/system/prometheus.service
Copy and paste the following:
[Unit]
Description=Prometheus Server
Documentation=https://prometheus.io/docs/introduction/overview/
After=network-online.target

[Service]
User=prometheus
Group=prometheus
Restart=on-failure
ExecStart=/opt/prometheus/prometheus --config.file=/opt/prometheus/prometheus.yml --storage.tsdb.path=/opt/prometheus/data --web.external-url=http://localhost:9090

[Install]
WantedBy=multi-user.target
The Prometheus service file contains three important components in the above example:
- The absolute path to the configuration file (which we will set up next)
- The absolute path to where Prometheus will store its data (change as you see fit)
- The http address and port Prometheus will be accessible at
Setting up the Prometheus configuration file
The Prometheus server has a lot of configuration options. However, to keep it simple, we’re going with a light-weight default to get up and running quickly. You can always check the documentation on additional options available to suit your needs. For now, open up /opt/prometheus/prometheus.yml using your favorite editor and copy/paste in the following:
# My Global Prometheus Config
global:
  scrape_interval: 60s # Set the scrape interval to every 15 seconds. Default is every 1 minute.
  evaluation_interval: 60s # Evaluate rules every 15 seconds. The default is every 1 minute.
  # scrape_timeout is set to the global default (10s).

# A scrape configuration containing exactly one endpoint to scrape:
scrape_configs:
  # The job name is added as a label `job=<job_name>` to any timeseries scraped from this config.
  - job_name: "webserver"
    static_configs:
      - targets: ["localhost:9100"]
  # If you had more than one node, you could add it to the above target list or create a new job as shown below
  #- job_name: "mailserver"
  #    static_configs:
  #      - targets: ["192.168.1.101:9100"] # Replace the IP of course!
If you’re following along, and are only installing on a single node, then the above will work out of the box. The targets directive list items are the IP:port locations of your Node Exporter end-points. You can add additional node_exporter instances via ip:port in the targets block. Just make sure you use a valid YAML list format. Here’s an example of setting up a single job that includes multiple nodes.
- job_name: "servers"
    static_configs:
      - targets:
        - 192.168.1.101:9100
        - 192.168.1.102:9100
        - 192.168.1.103:9100
You can name the job_name property anything you like. It will be passed along with your metric labels, so make it something recognizable since we will be using it in our queries in the dashboard.
Opening the ports on your Firewall
In this example, I am using Fedora’s firewalld. If you’re on Ubuntu, or another distro, make sure you Google how to open the following ports using your distro’s command line tool.
sudo firewall-cmd --get-default-zone
> FedoraServer
sudo firewall-cmd --permanent --zone=FedoraServer --add-port=9100/tcp
> success
sudo firewall-cmd --permanent --zone=FedoraServer --add-port=9090/tcp
> success
sudo firewall-cmd --reload
> success
Now, we should be able to communicate with our Prometheus and Node Exporter endpoints. More importantly, they should be able to talk to each other.
Starting up the Services
Start and enable all your Node Exporter instances. If you installed Node Exporter on multiple servers, run the below command on each before proceeding:
sudo systemctl enable --now node_exporter
Make sure the service is running and there are no errors:
sudo systemctl status node_exporter
By passing the --now option we are starting the node_exporter.service immediately and enabling it to start automatically on reboot.
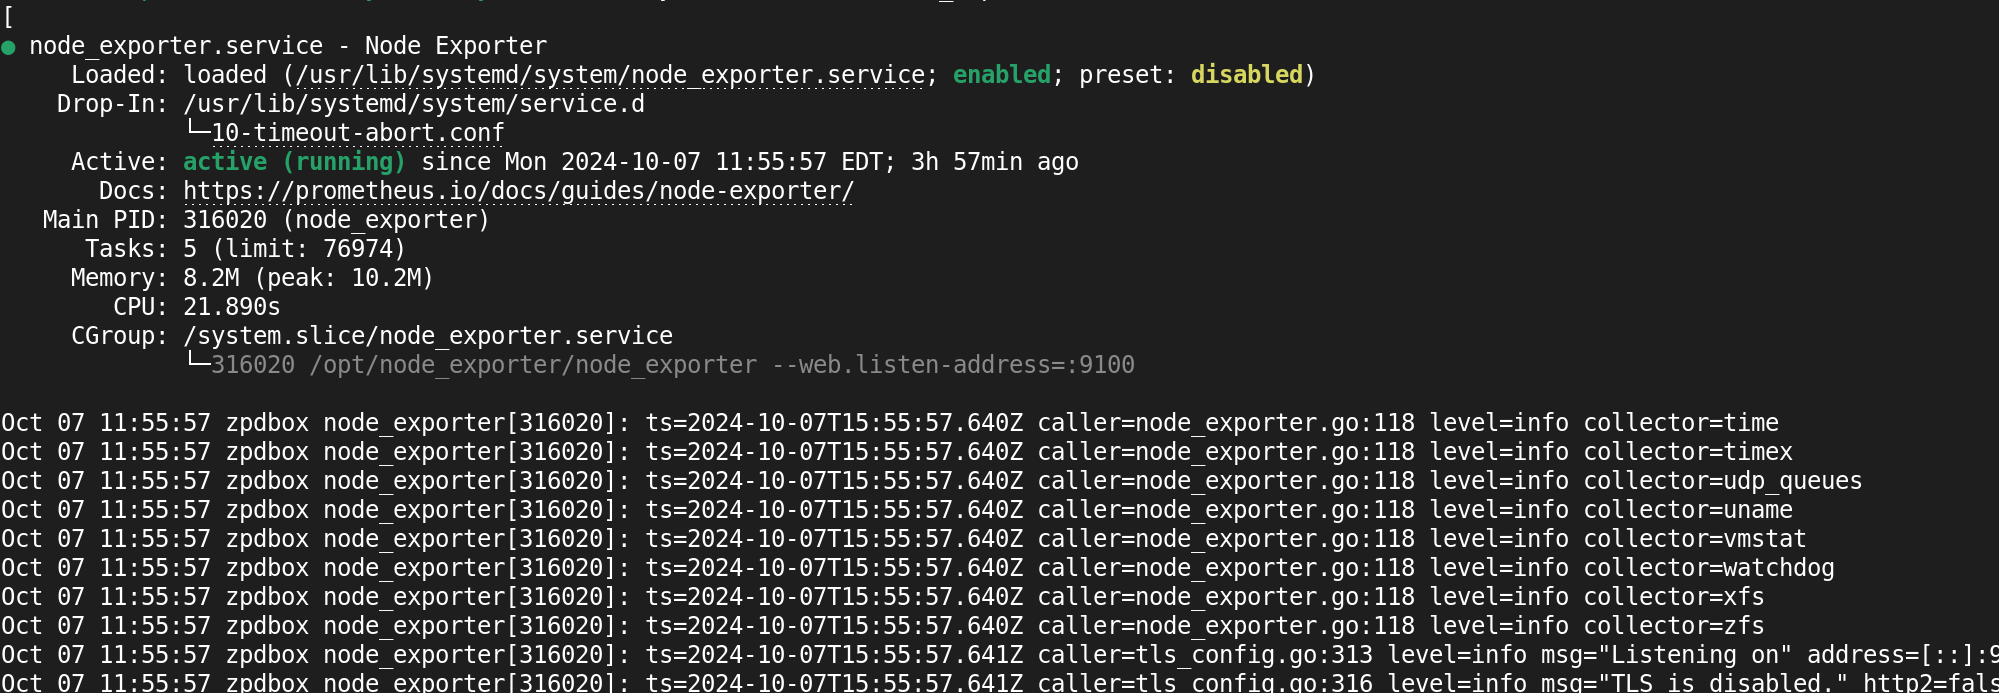
Once all your node exporter instances are enabled and started without error, start up the Prometheus server:
sudo systemctl enable --now prometheus
Make sure the service is running and there are no errors:
sudo systemctl status prometheus
You should be able to visit the Prometheus server at http://localhost:9090. (Replace localhost with the IP you installed your Prometheus server on)
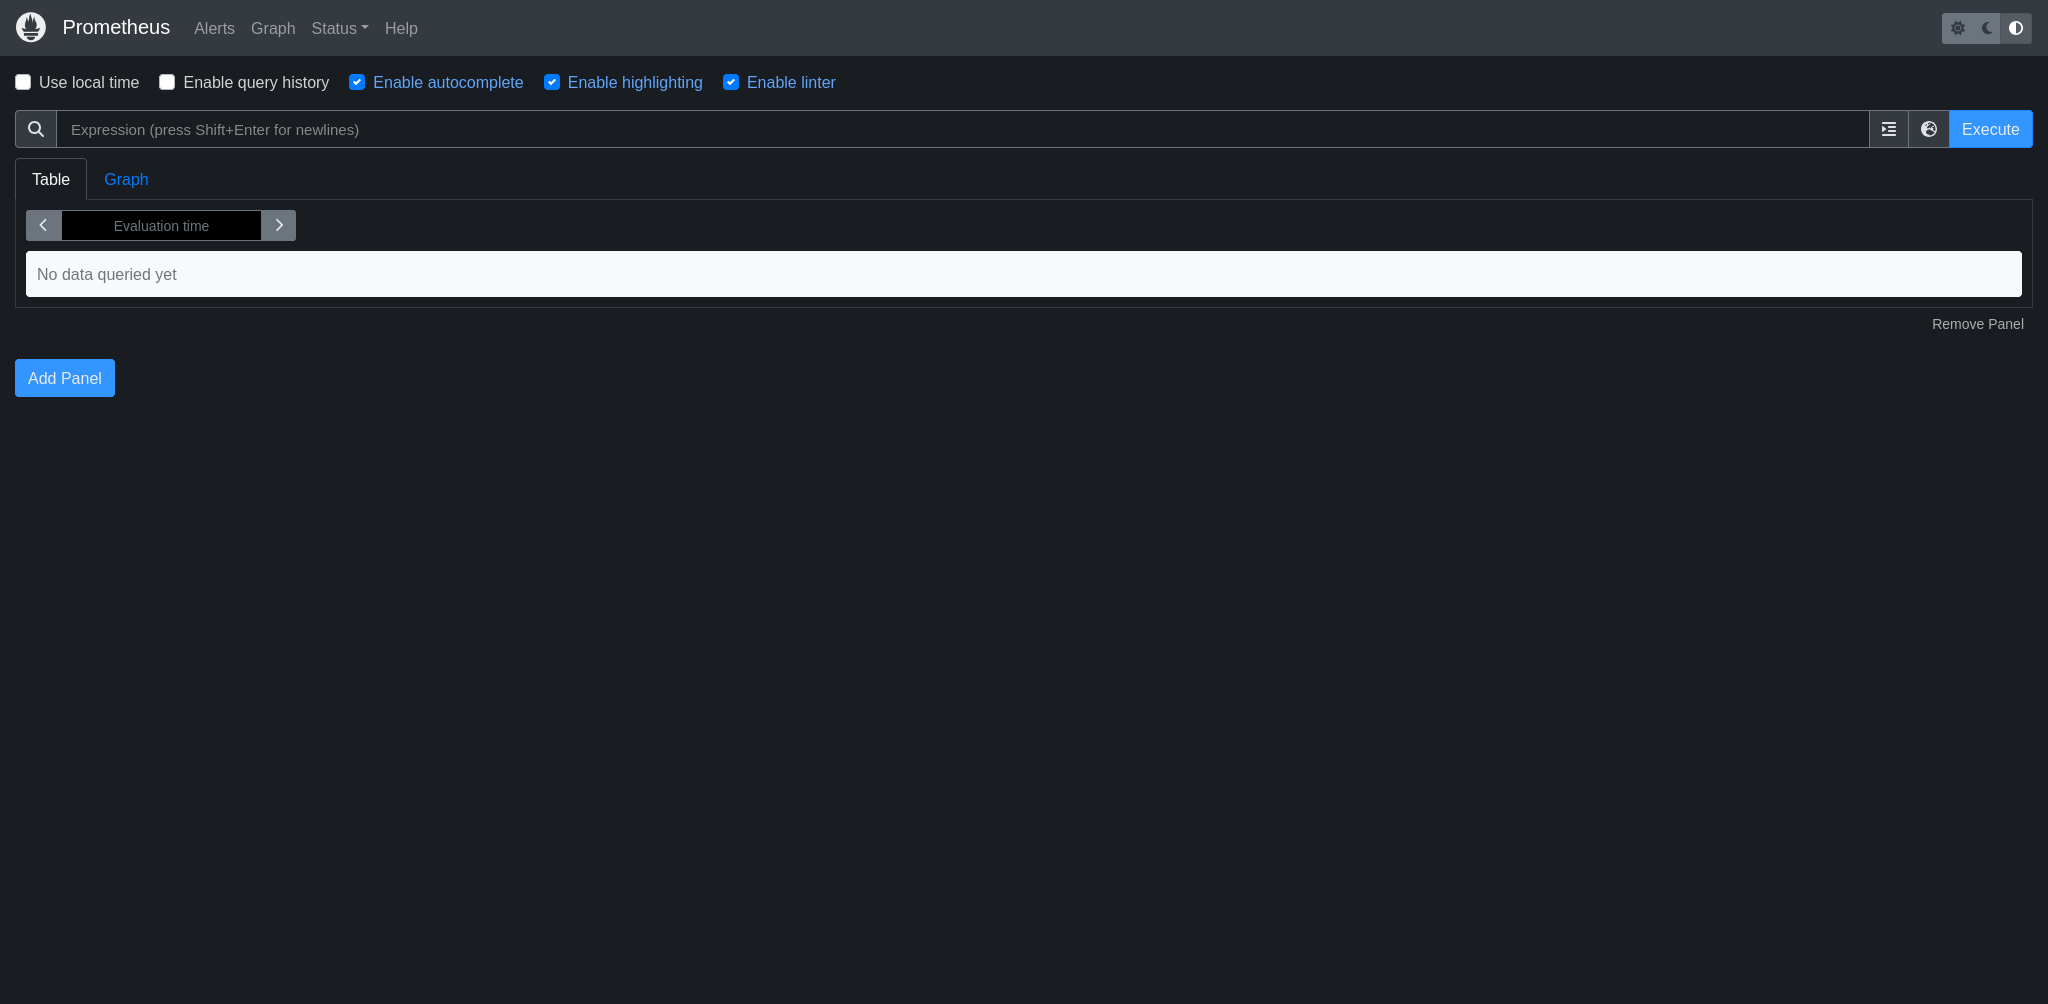
From this page, select the “Status” dropdown menu and choose “Targets.” Here, you should see all the various node exporter targets. If all went to plan, they should be reporting in an “up” state. If not, you will need to go check the logs for that node_exporter instance. You can get logs for your service by running the following command on the machine it’s installed on:
sudo journalctl -u node_exporter
This web interface offers a quick and easy way to inspect and graph values on the fly. It’s a good way to learn how to use the built-in query language. Give it a shot, use the following in the query bar to see what you get (make sure to substitute the job name with the one you chose in your config):
rate(node_cpu_seconds_total{job="webserver"}[5m])
In table view, you will see a list of the metrics in raw form. When you click on Graph, you should see a basic visualization of CPU performance broken out by core. While this is a decent interface to get some quick answers, we’re going to take it to the next level and start persisting visualizations with more advanced options and display settings. We’ve confirmed we’re getting data, so let’s move on and install the Perses dashboard.
Download and Install Perses
Perses is a Cloud Native Computing Foundation sandbox project and a dashboard tool to visualize observability data from Prometheus, Thanos, and Jaeger. Since we will be using Docker to install it, this next part will be quick and painless.
docker run --name perses -d -p 8080:8080 persesdev/perses
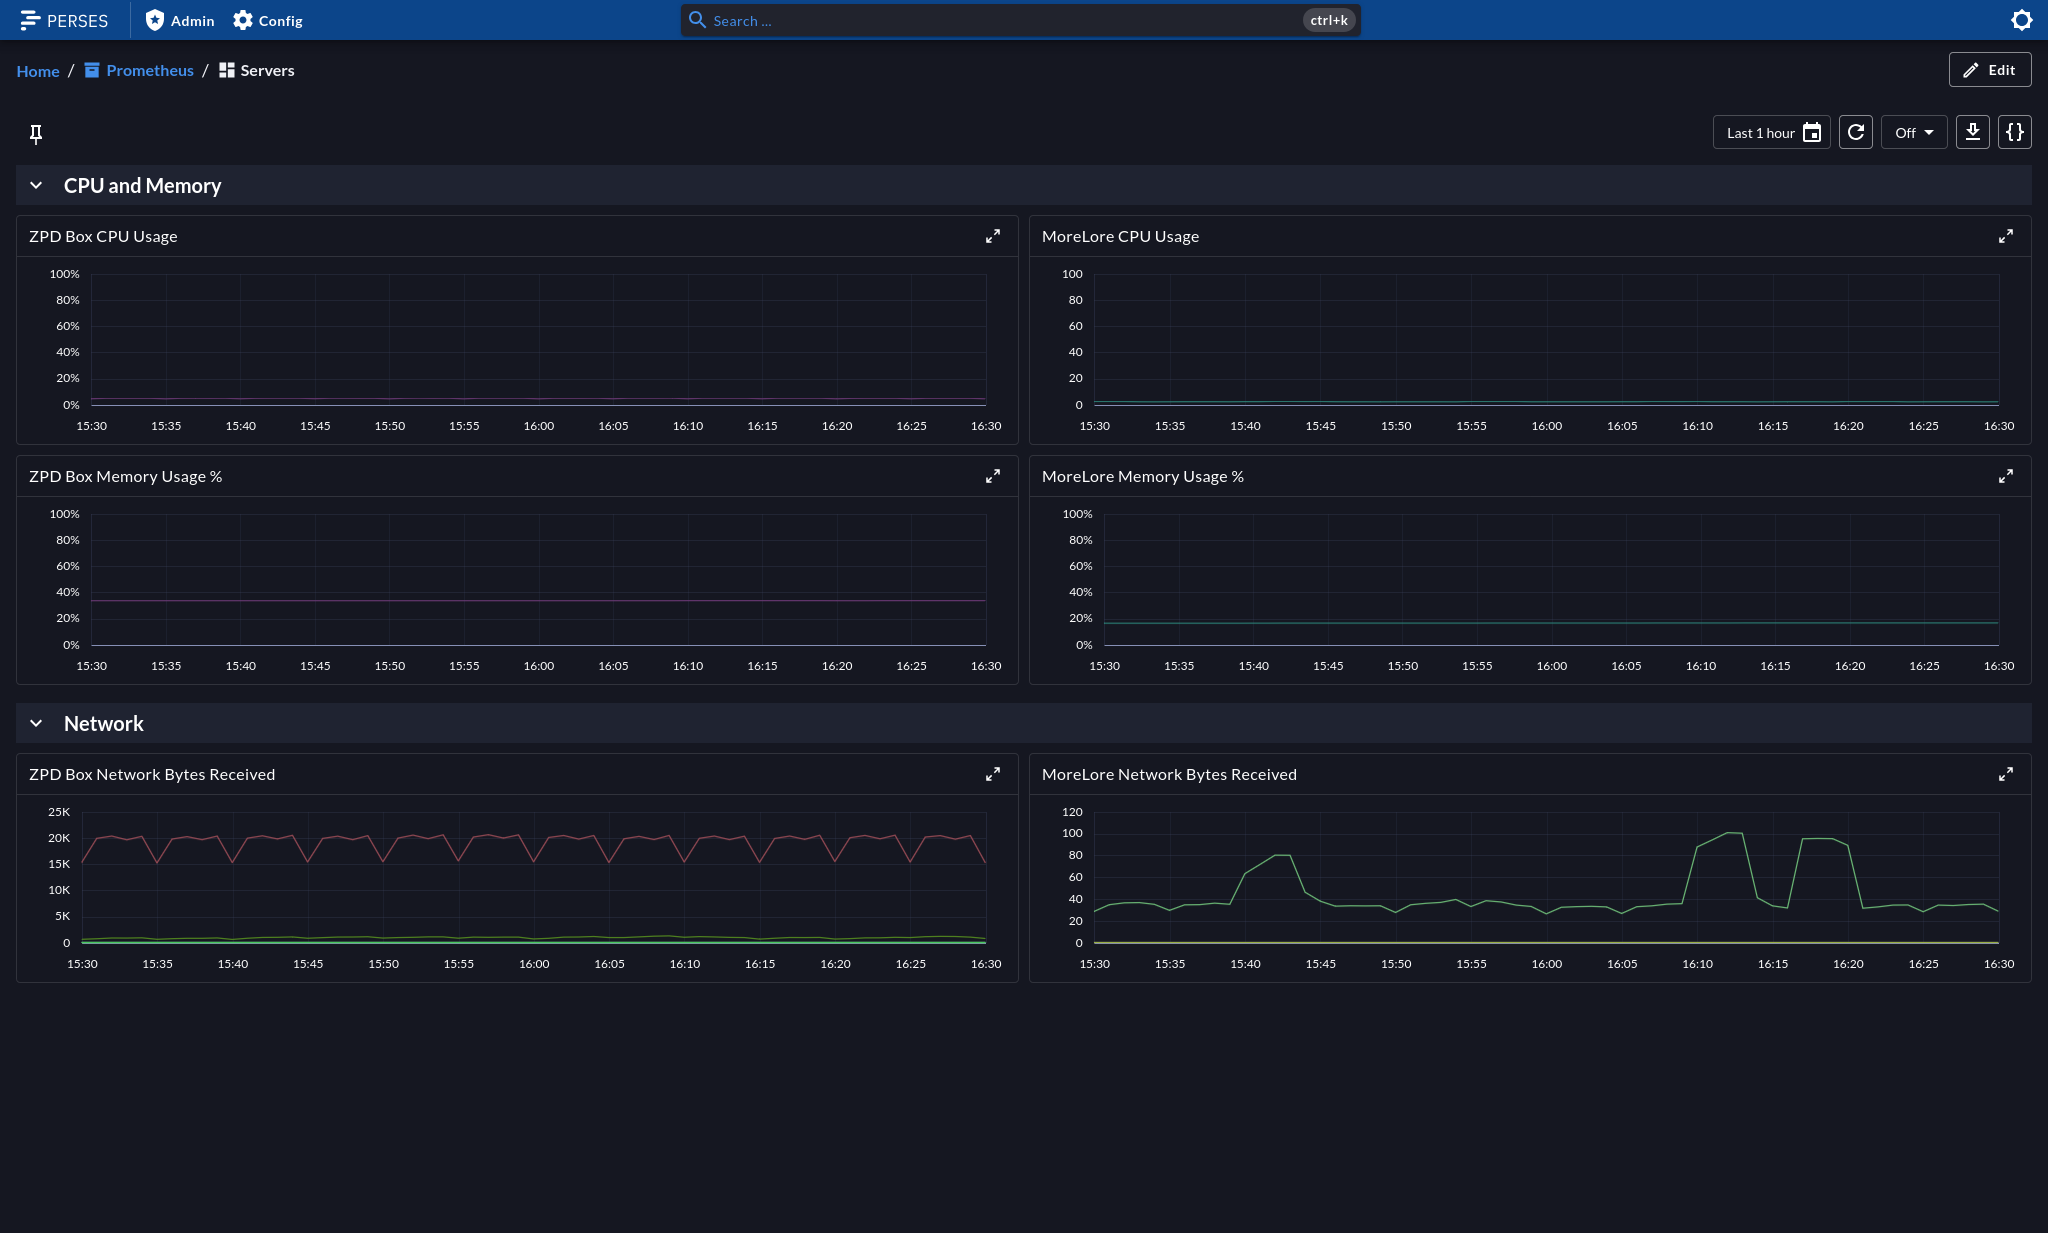
To setup Perses to access our current Prometheus data source, create a project. You can name it whatever you want. A project is an organizational construct for your various dashboards. Once you’ve created your project, click on “Data Sources.” In my case, I set the Prometheus server up on a local node with the IP 192.168.100.100.
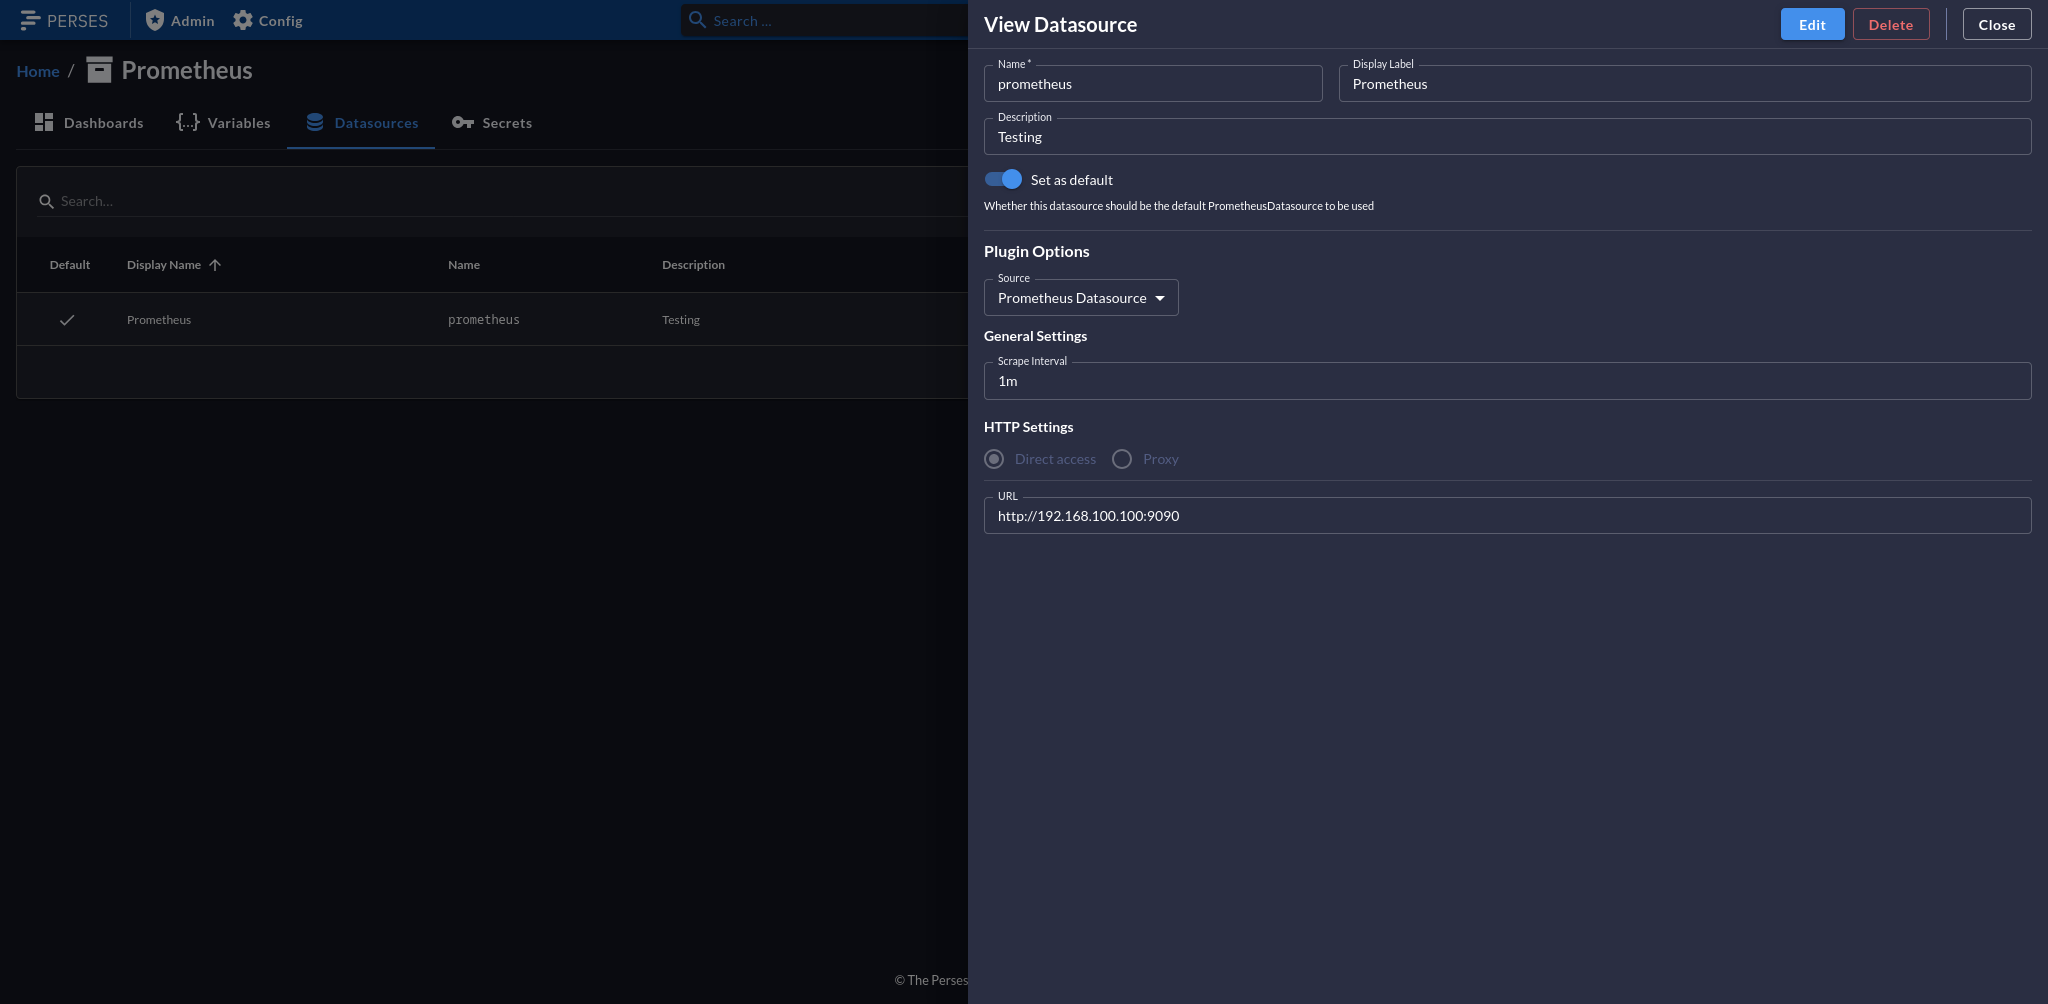
Once you are connected, any dashboard you create in this project can create visualizations against that data source. I will leave it up to you to create some panels. Here’s a couple of queries to get you started for CPU and Memory utilization (expressed as percentages).
# Change the jobname to match your use case
# CPU
avg without (mode,cpu) (
    100 * (1 - rate(node_cpu_seconds_total{mode="idle",job="webserver"}[5m]))
)
# Memory
100 * (1 - ((avg_over_time(node_memory_MemFree_bytes{job="webserver"}[5m]) + avg_over_time(node_memory_Cached_bytes{job="webserver"}[5m]) + avg_over_time(node_memory_Buffers_bytes{job="webserver"}[5m])) / avg_over_time(node_memory_MemTotal_bytes{job="webserver"}[5m])))
Visualizations are highly customizable. You can set maximum and minimum values to get a more accurate comparison against data from other panels that use the same or similar data sets. Panels are collapsable containers to help keep your visualizations organized and you dashboard free of clutter. In the screen-shot above, I am using CPU and Memory in one panel, and Network IO in another. Once you’re finished editing, make sure to click “Save!” Experiment, add visualizations, Google for query examples on Stack Overflow - have fun!
Wrapping up
I hope this article helped you get up and running! There are not a lot of tutorials out there when it comes to setting up these services on dedicated hardware. After this, you should be ready to start monitoring your servers! There were a lot of things we left undone. For one, we don’t have any authentication on any of our server-side web user interfaces. If you’re using locally, then it’s really no issue. However, if you’re planning on deploying this live, make sure you have network and RBAC controls in place to prevent sensitive performance info from getting out to bad guys. I plan on doing another tutorial in the near future on Grafana. I use it all the time in my professional role as an Information System Security Engineer, and there is a lot of stuff you can do with it to help with visibility and Zero Trust. Learning the power of the query language is a “must” to tweak your data into something usable. It will take time, but now you should be on the right track to make something awesome! Good luck, and I’ll see you again soon.


